Every map tells a story, or at least it should, by our standards.
Without telling a story, a map is simply a pretty picture with points, lines and irregular shapes. No one hires a cartographer or GIS specialist to create a map for the sake of creating a map. It needs to solve a problem or provide vital information to the reader.
Oftentimes, it simply demonstrates local or regional geography in relation to a point of reference, answering basic questions such as “What is my property close to?” or “Which amenities are present in this area?” In other situations, the questions are more complex. A client might need to solve a multifaceted problem involving many factors. Below are just three case studies that illustrate how we’ve solved some of our clients’ problems and enabled their maps to tell their own particular story.
Case Study #1
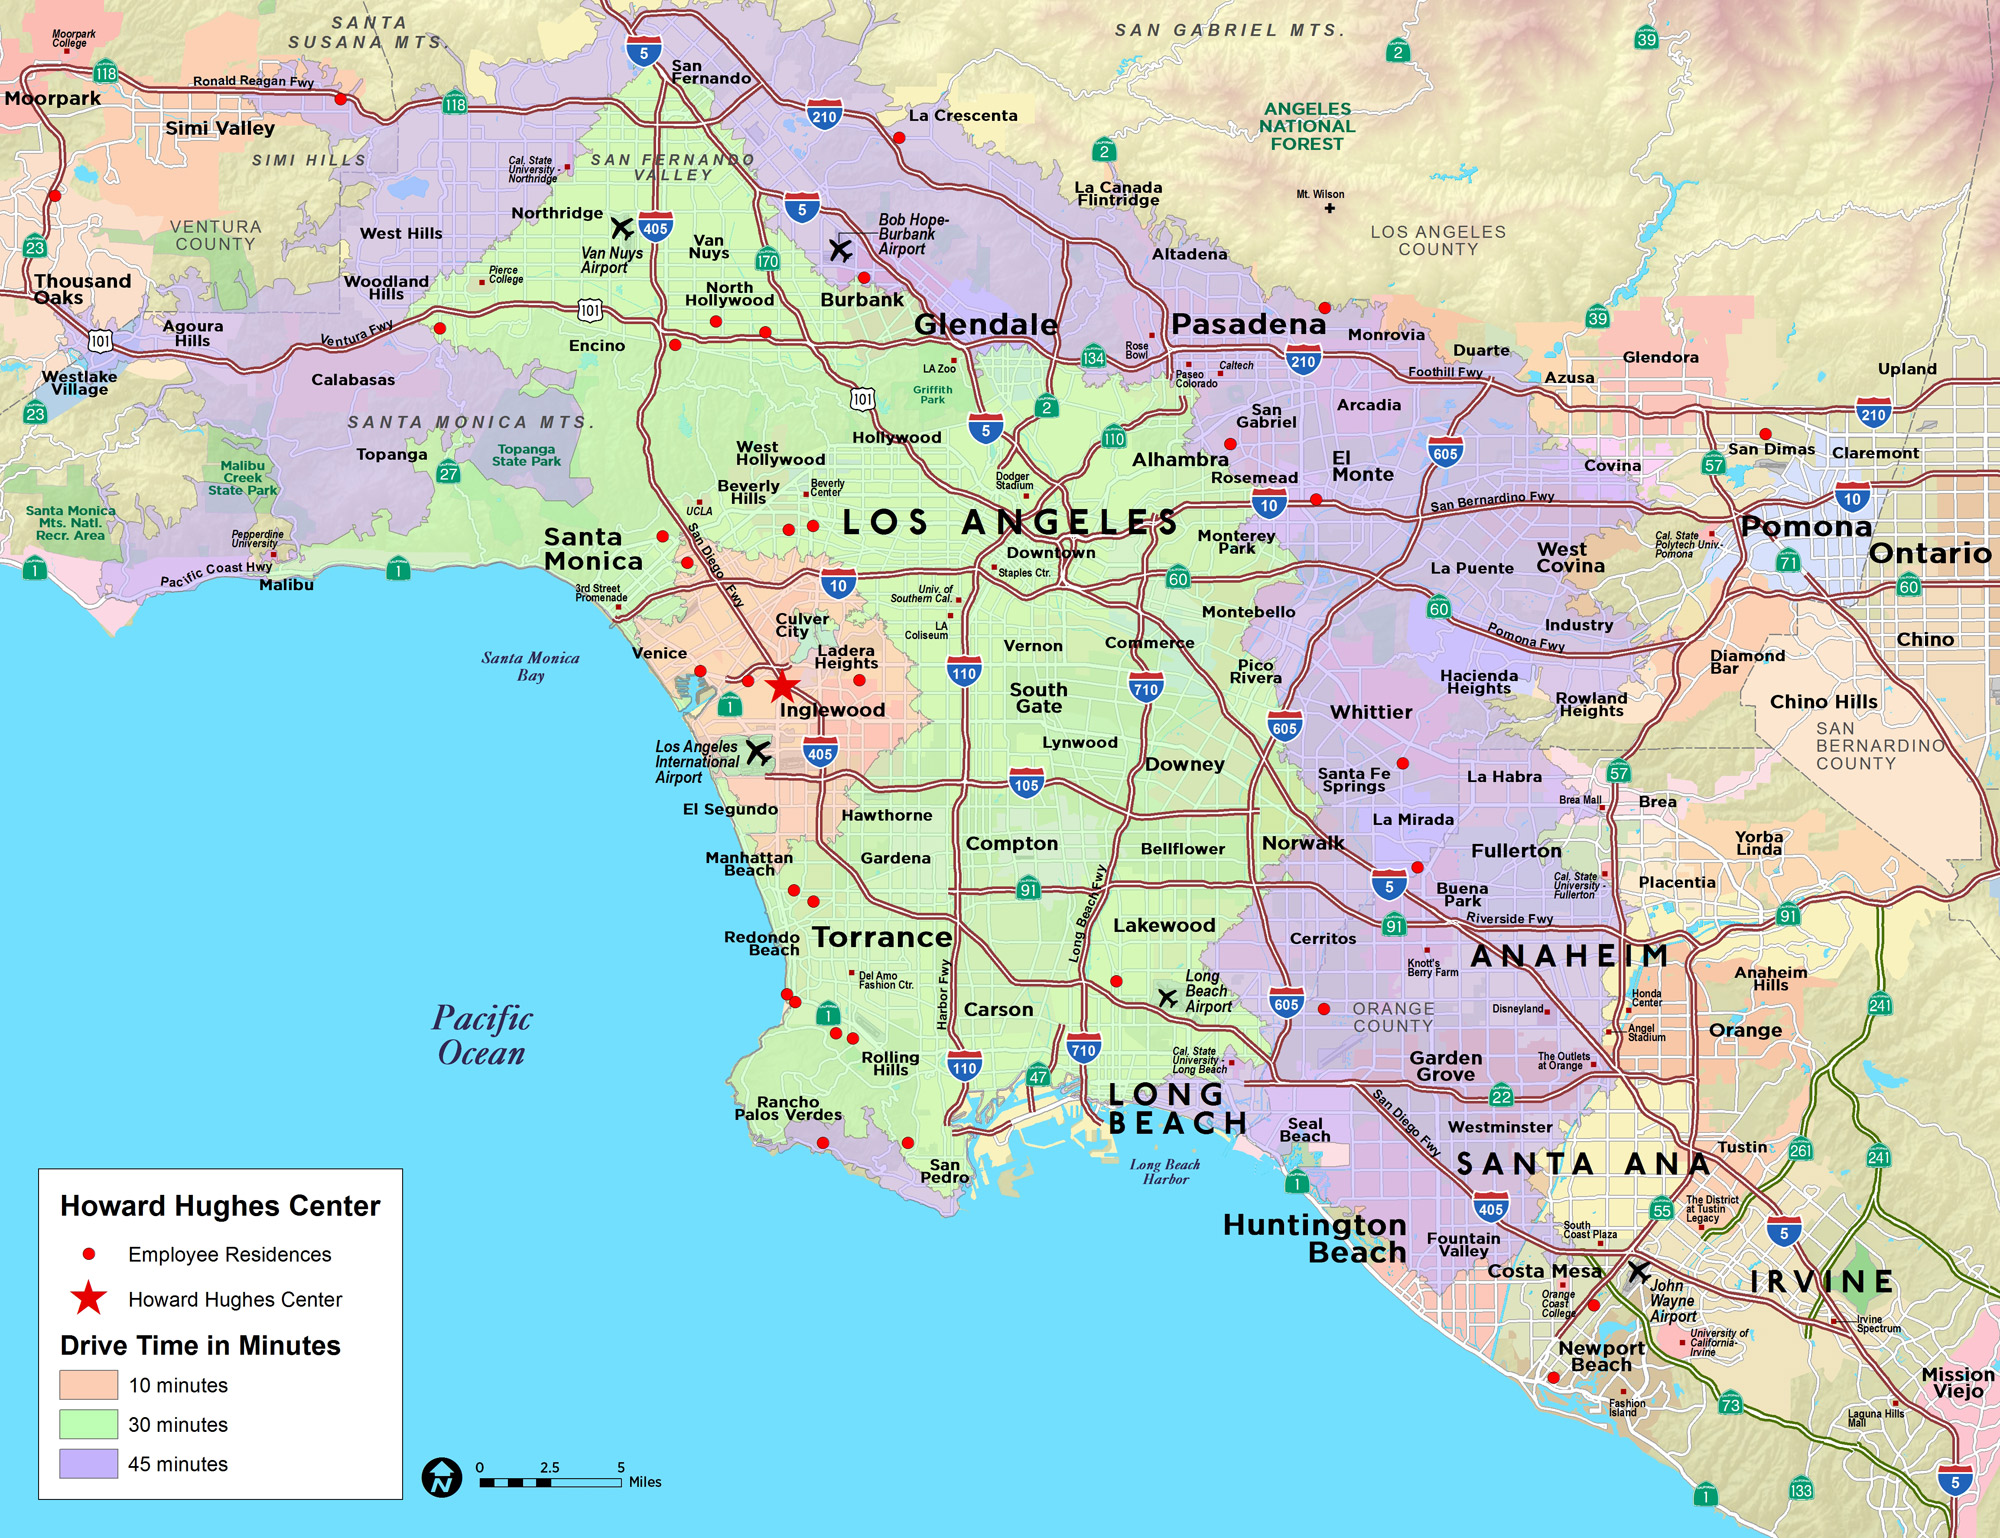
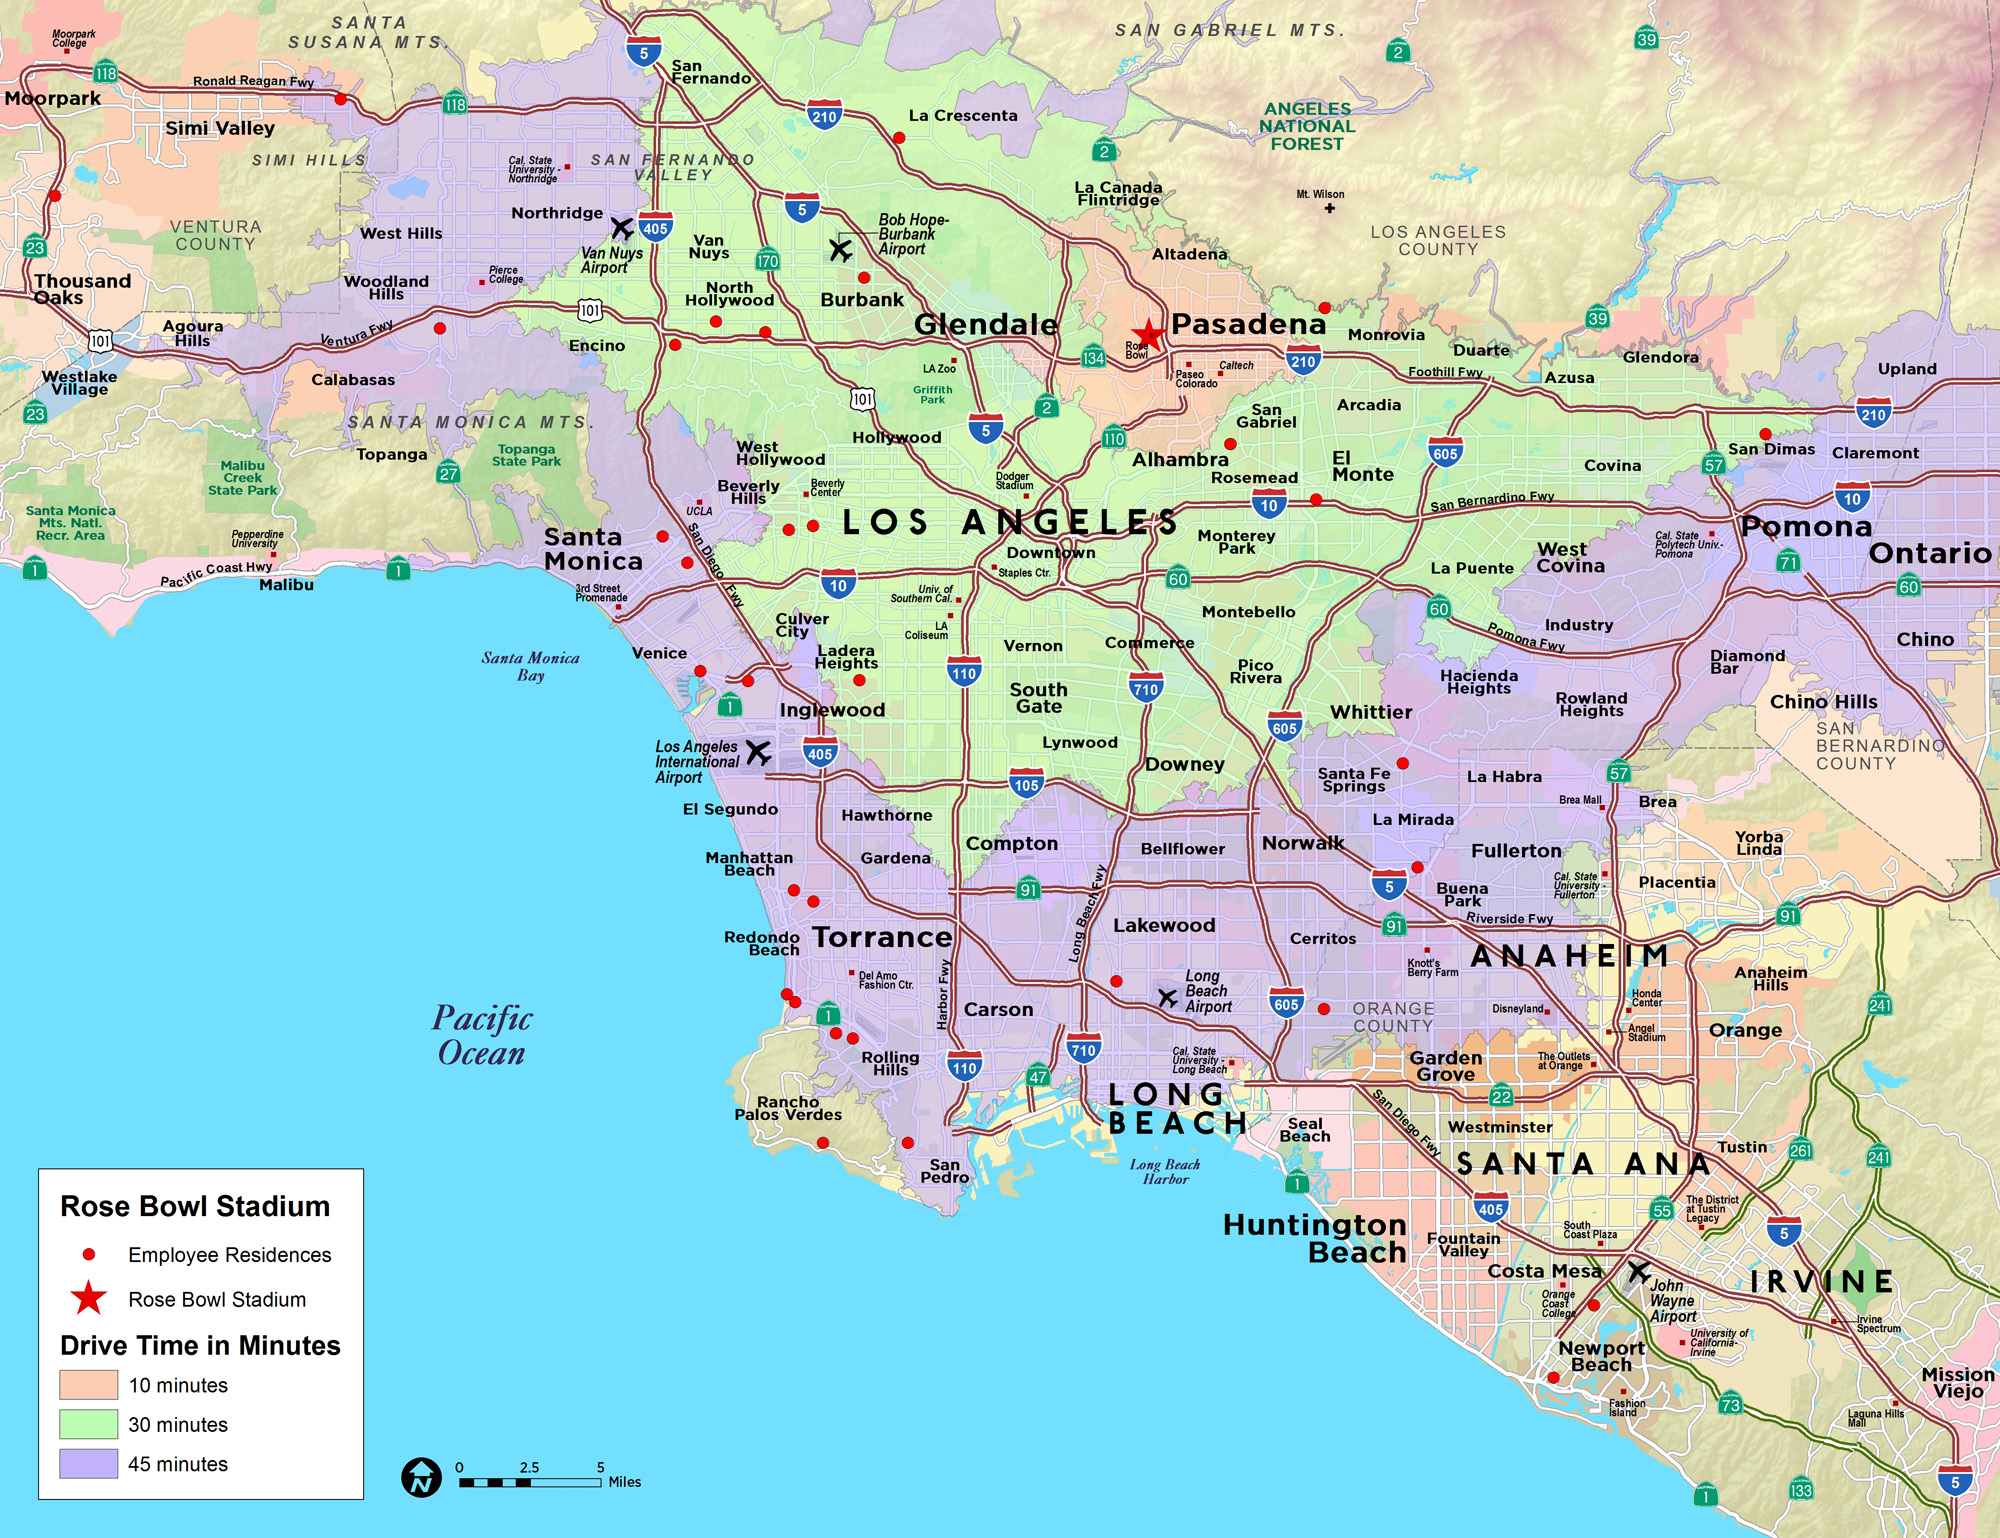
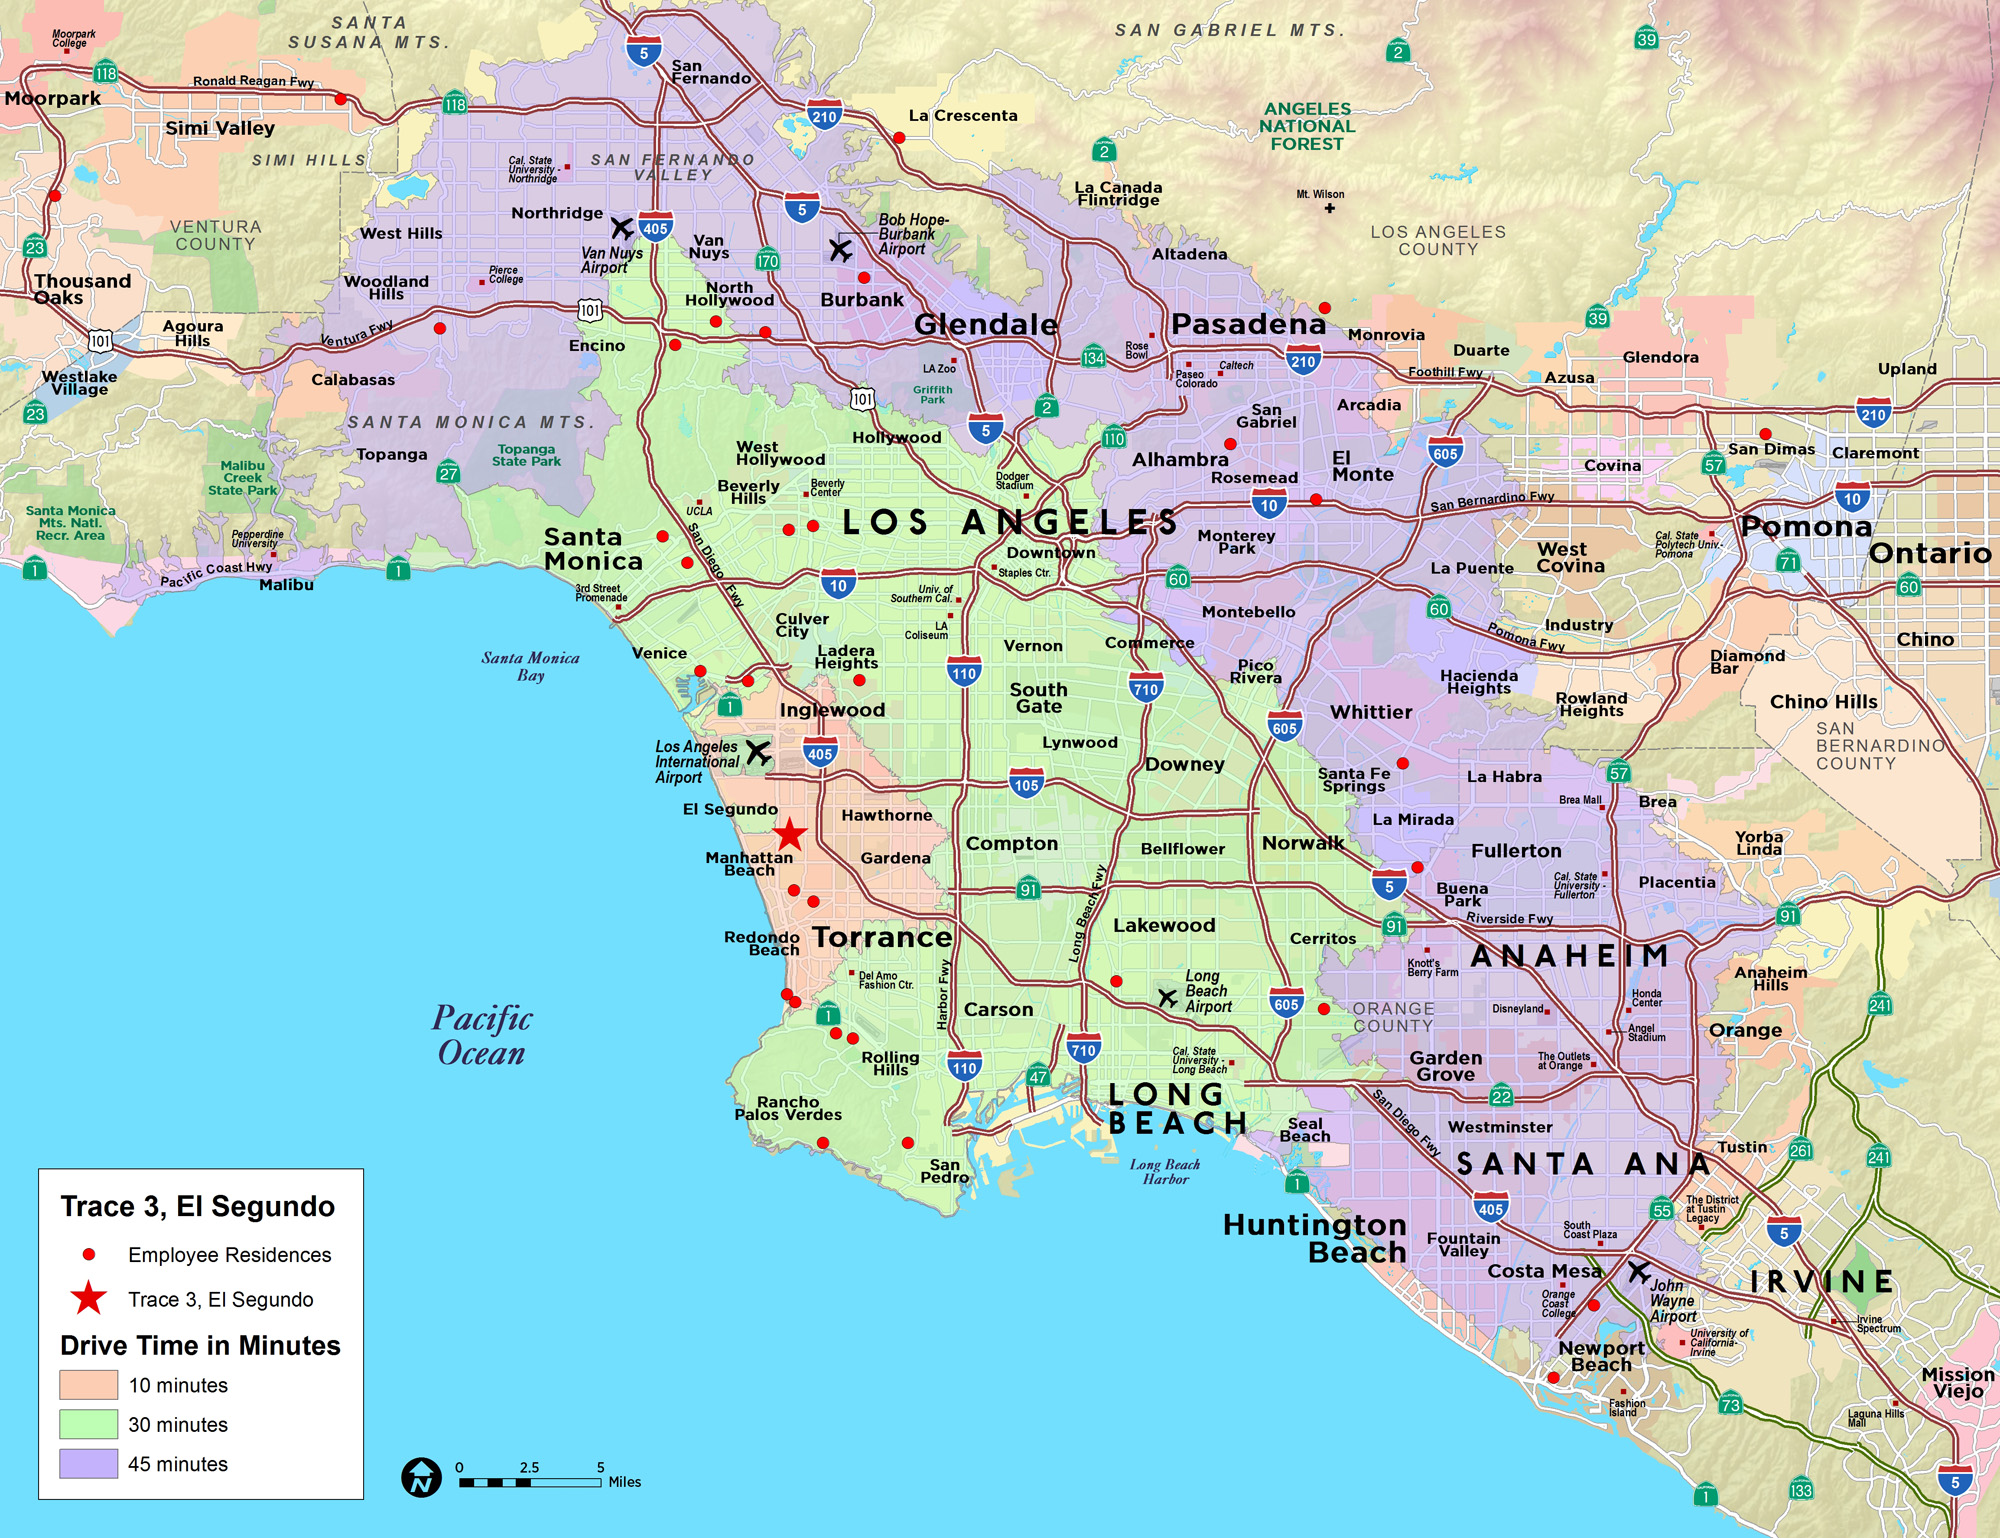
The Lincoln Property Company’s (LPC) Irvine, CA office in Orange County had been looking into moving further north to Los Angeles County, closer to the homes of many of its employees. Much of their staff lives scattered around the Greater Los Angeles Area, many of whom live a good deal north of Irvine. LPC had three possible relocation options: Pasadena, the Howard Hughes Center in West LA, and El Segundo just south of the airport. Based on these three options and their staff’s residences across the area, they needed to find the average driving time between each home and each possible new office location. After running three analyses, three distinct maps were created in order to illustrate the average drive times in each of these scenarios, all shown to the right.
Case Study #2
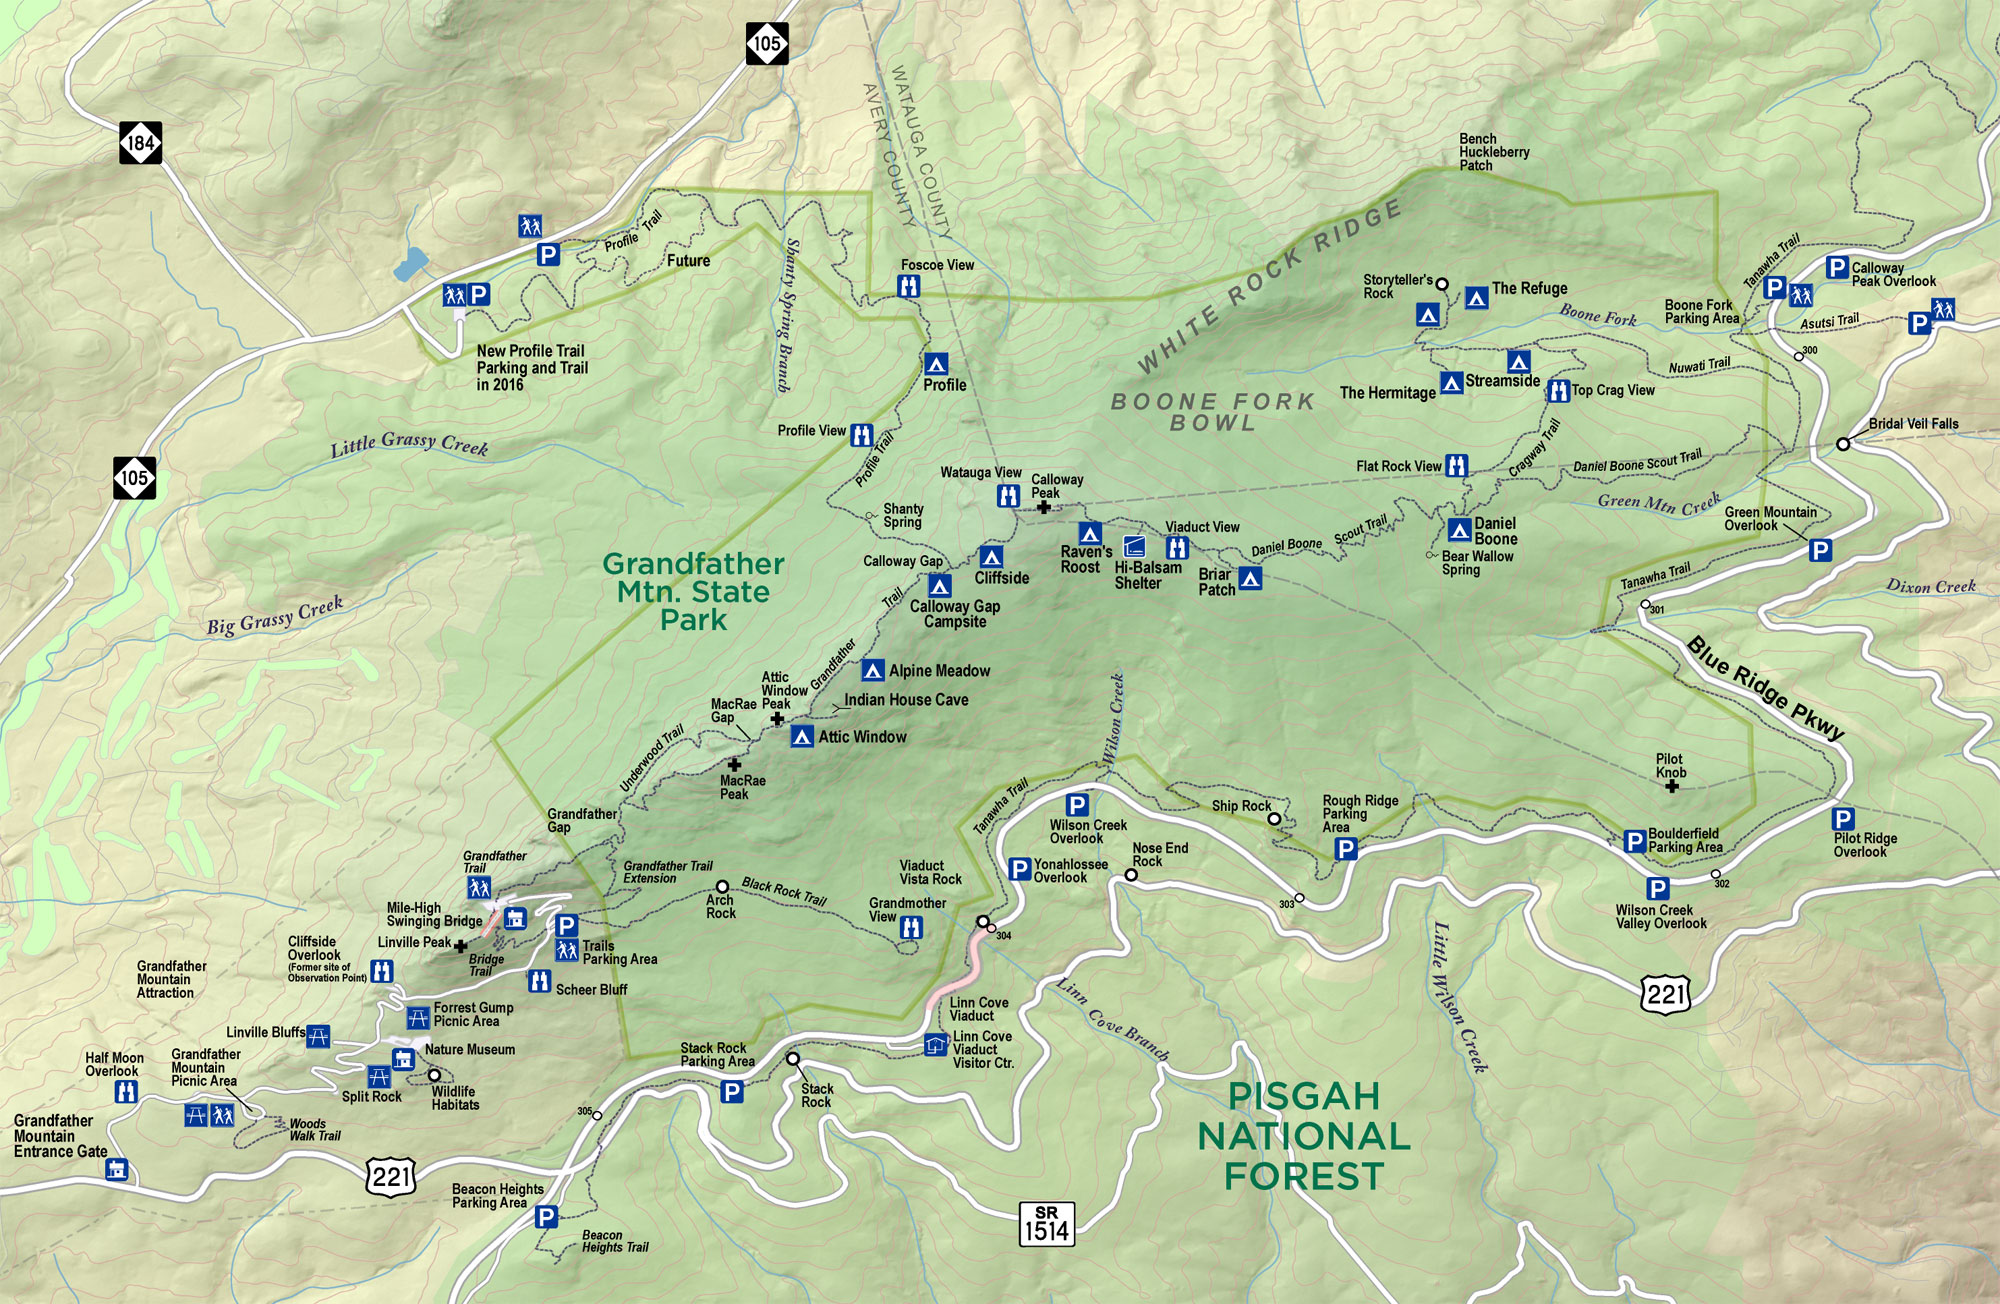
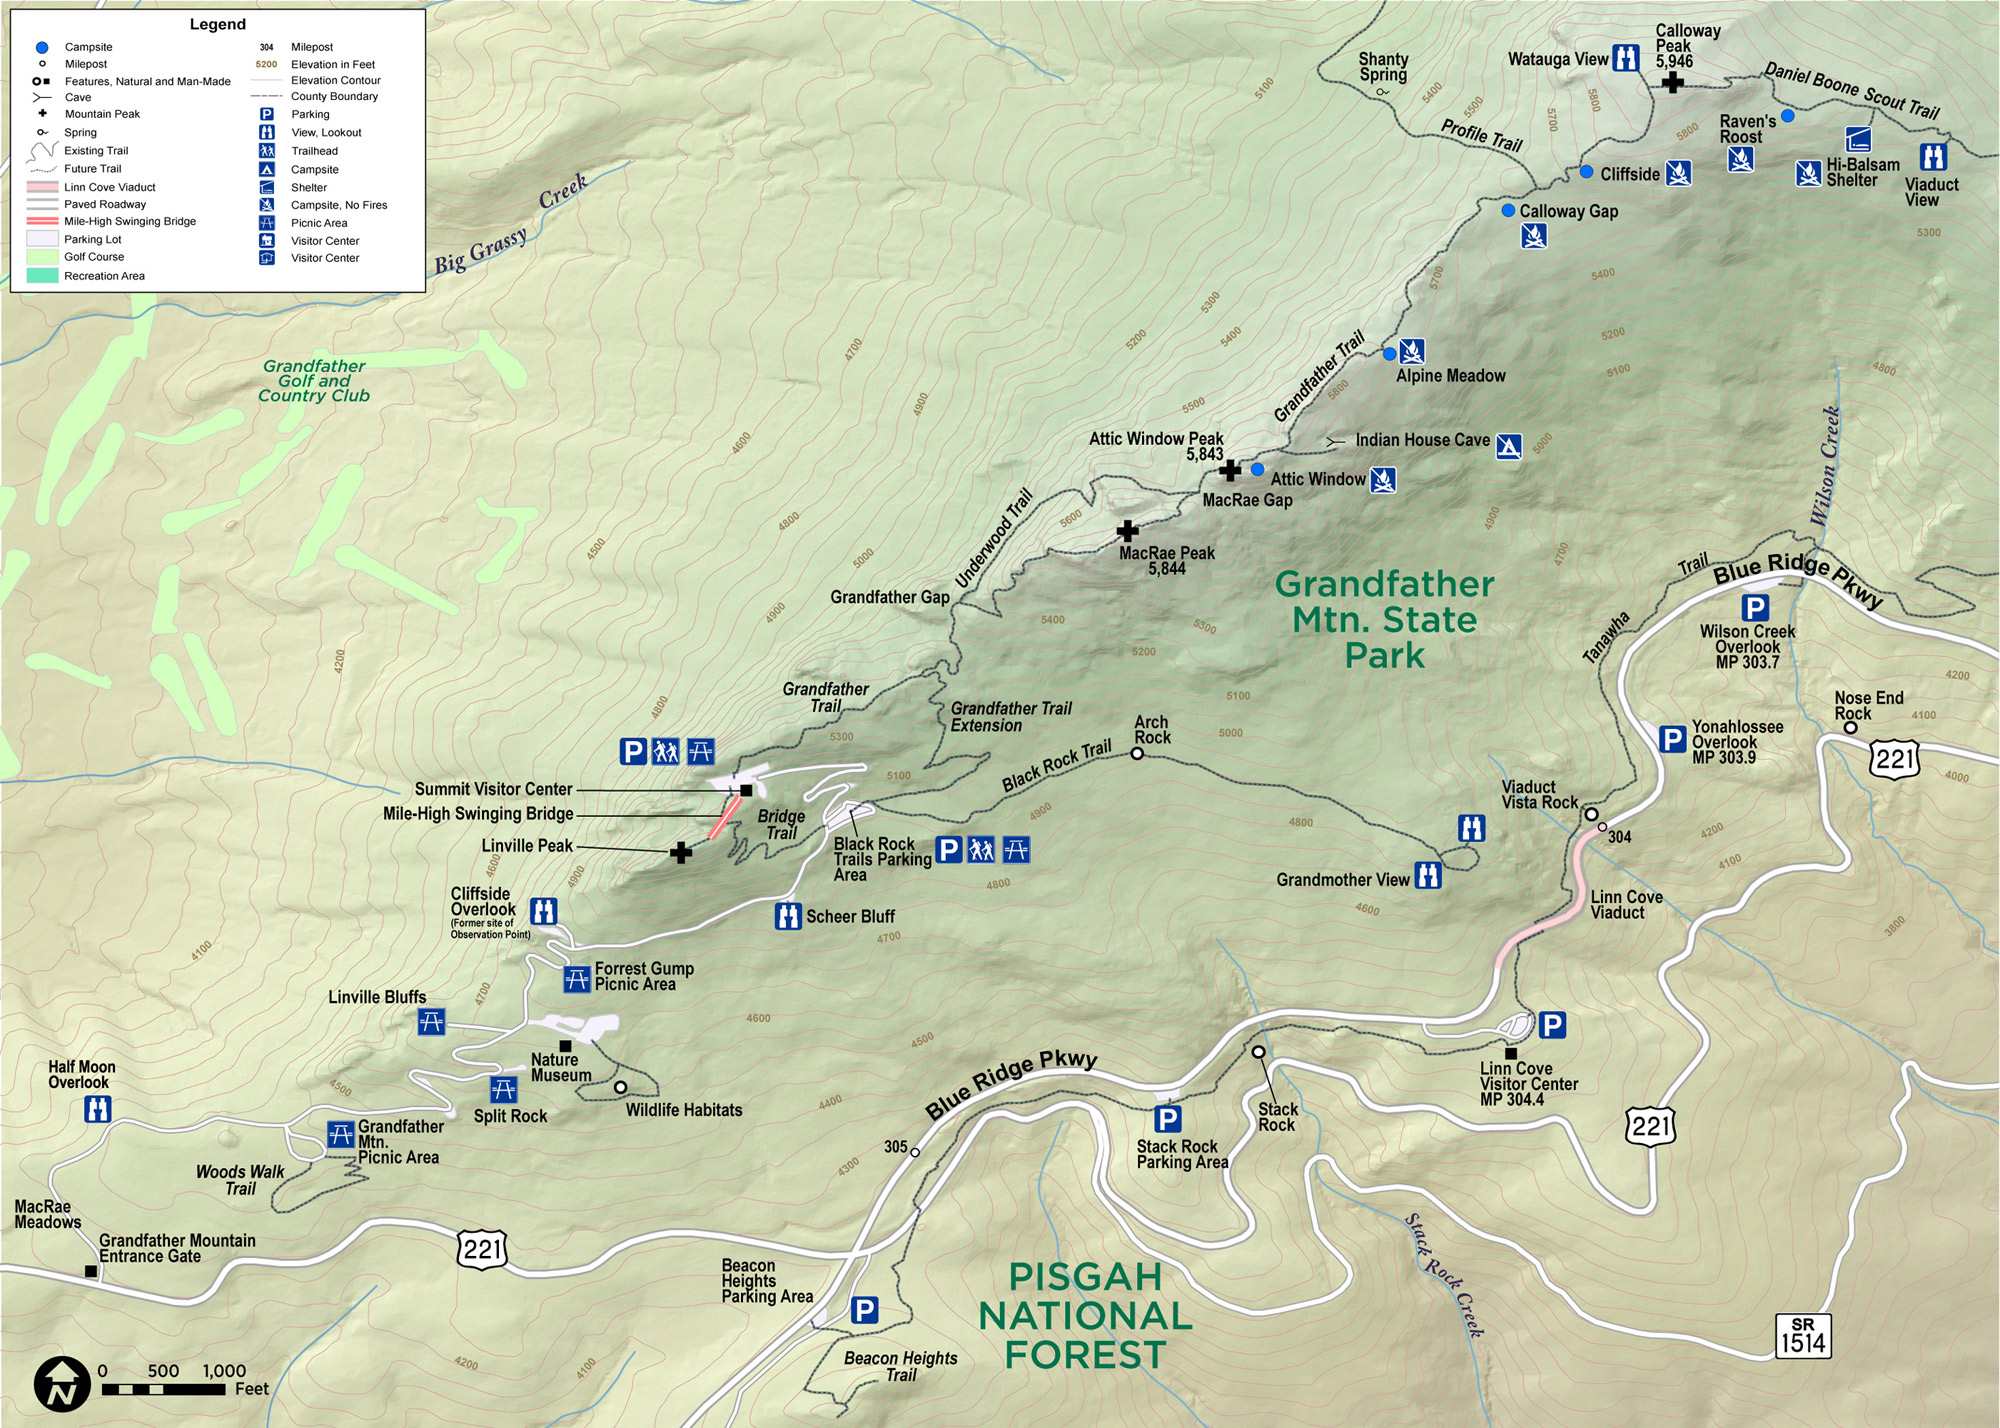
The University of North Carolina-Chapel Hill’s UNC Press was looking for an experienced and talented cartographer to prepare a set of four topographic maps for one of their authors’ upcoming books. They needed one overview map illustrating the Grandfather Mountain area in the Blue Ridge Mountains of Western North Carolina. Additionally, they needed three overlapping, detailed topographic maps displaying all of the current hiking trails and associated campsites, scenic lookouts, and mountain peaks. Within each of these overlapping maps, we adjusted the specific level of details in each, tweaking each to perfection. Red Paw found a clever way to streamline this process, which saved the client money and allowed us to deliver a superior product in less time than originally anticipated.
All four of these maps, including the two maps shown to the right, can now be found in Randy Johnson’s Grandfather Mountain: The History and Guide to an Appalachian Icon (2015).
Case Study #3
BlueWave Solar
BlueWave Solar is a Boston-based renewable energy project development company with a focus on solar photovoltaic (PV) development, and has solar projects in development in the United States, South Africa and the Caribbean. BlueWave Solar called upon Red Paw Technologies to help them find a second location in the State of Massachusetts upon which to build a new photovoltaic power station or “solar farm”.
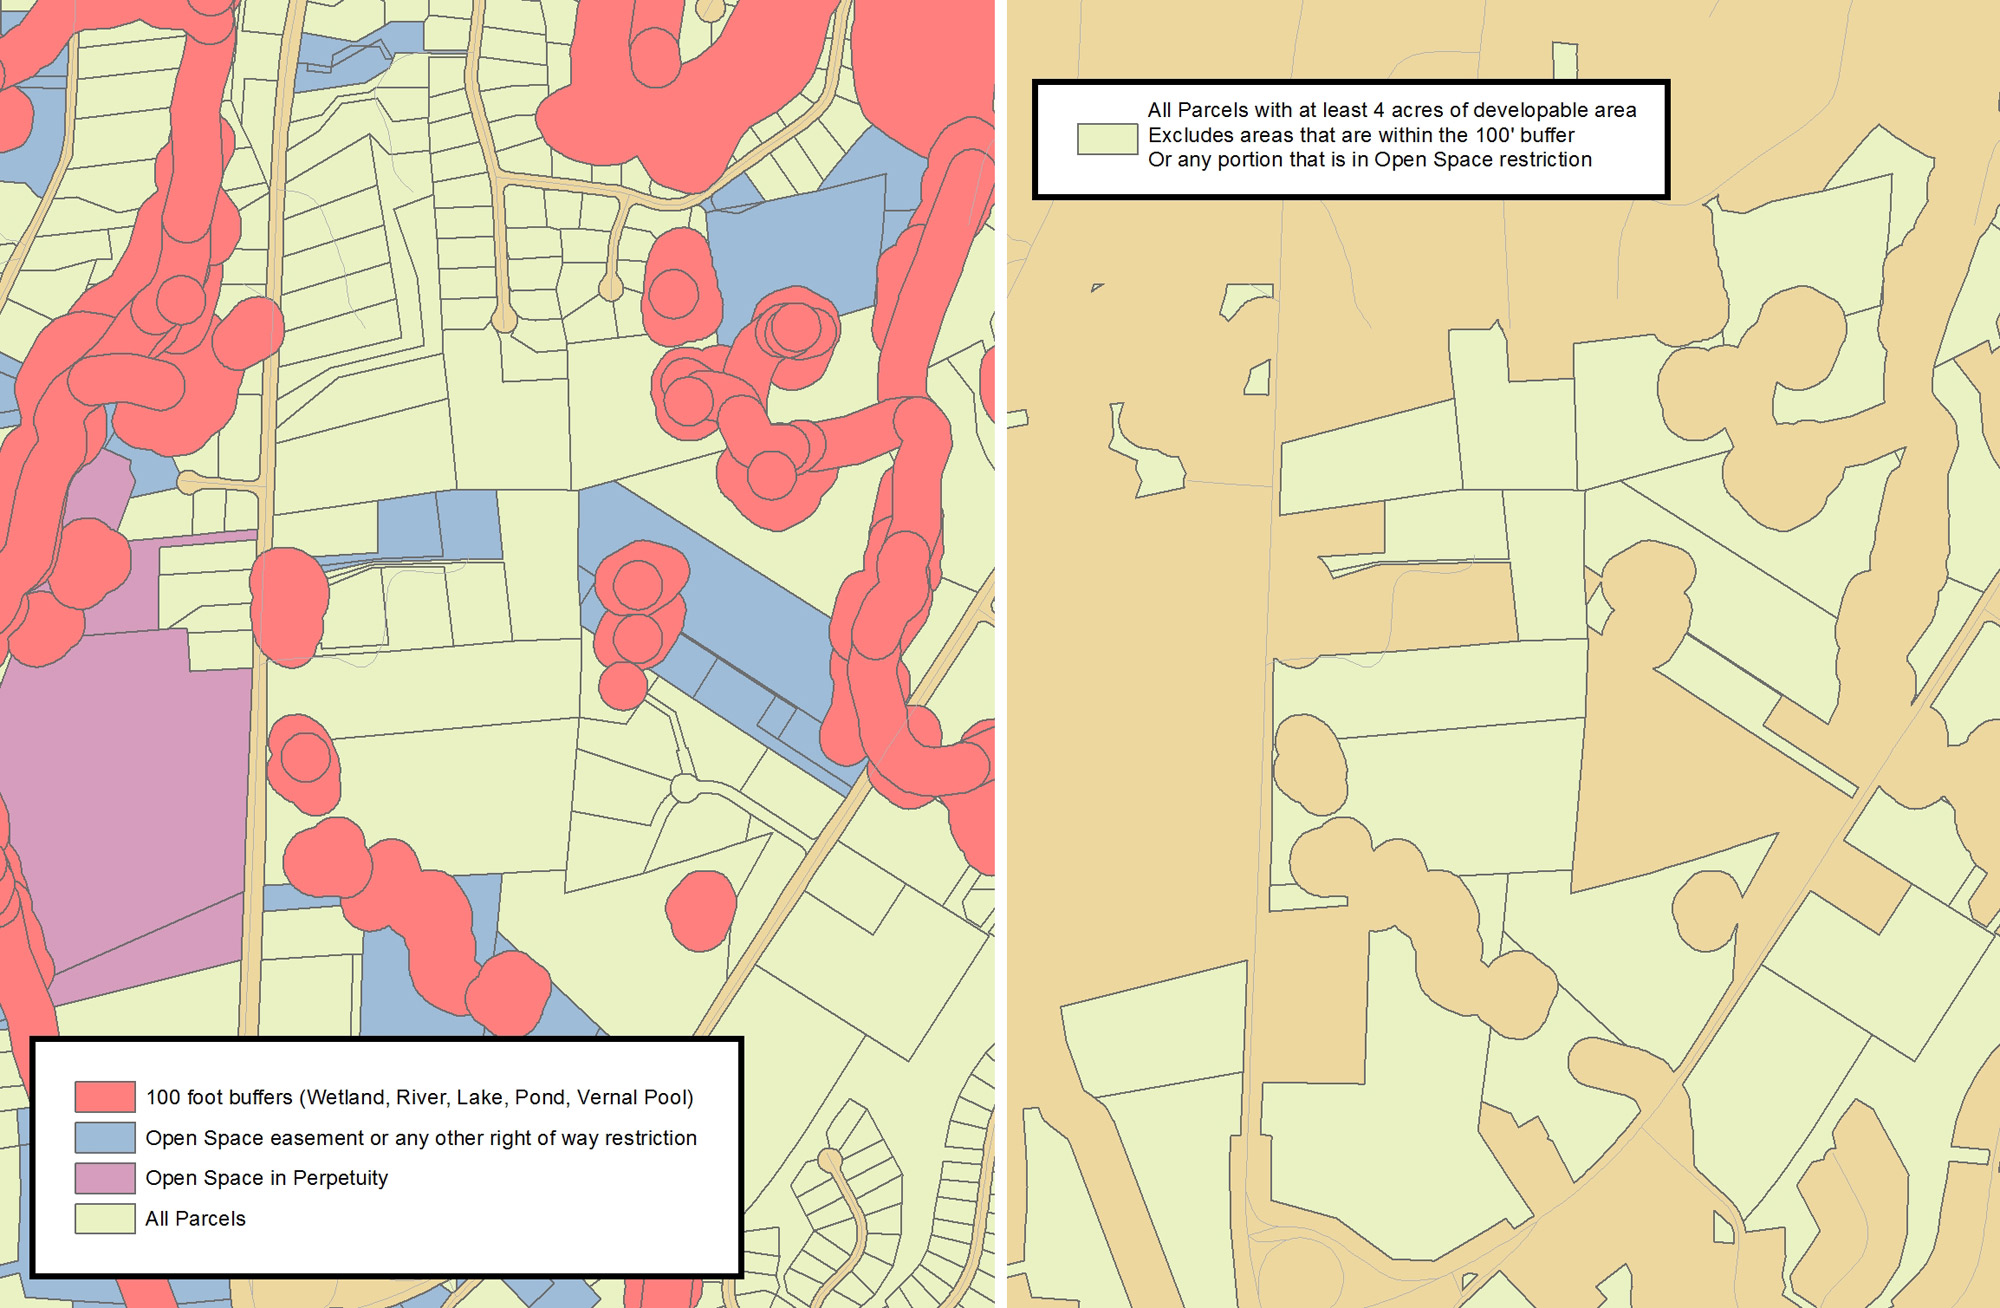
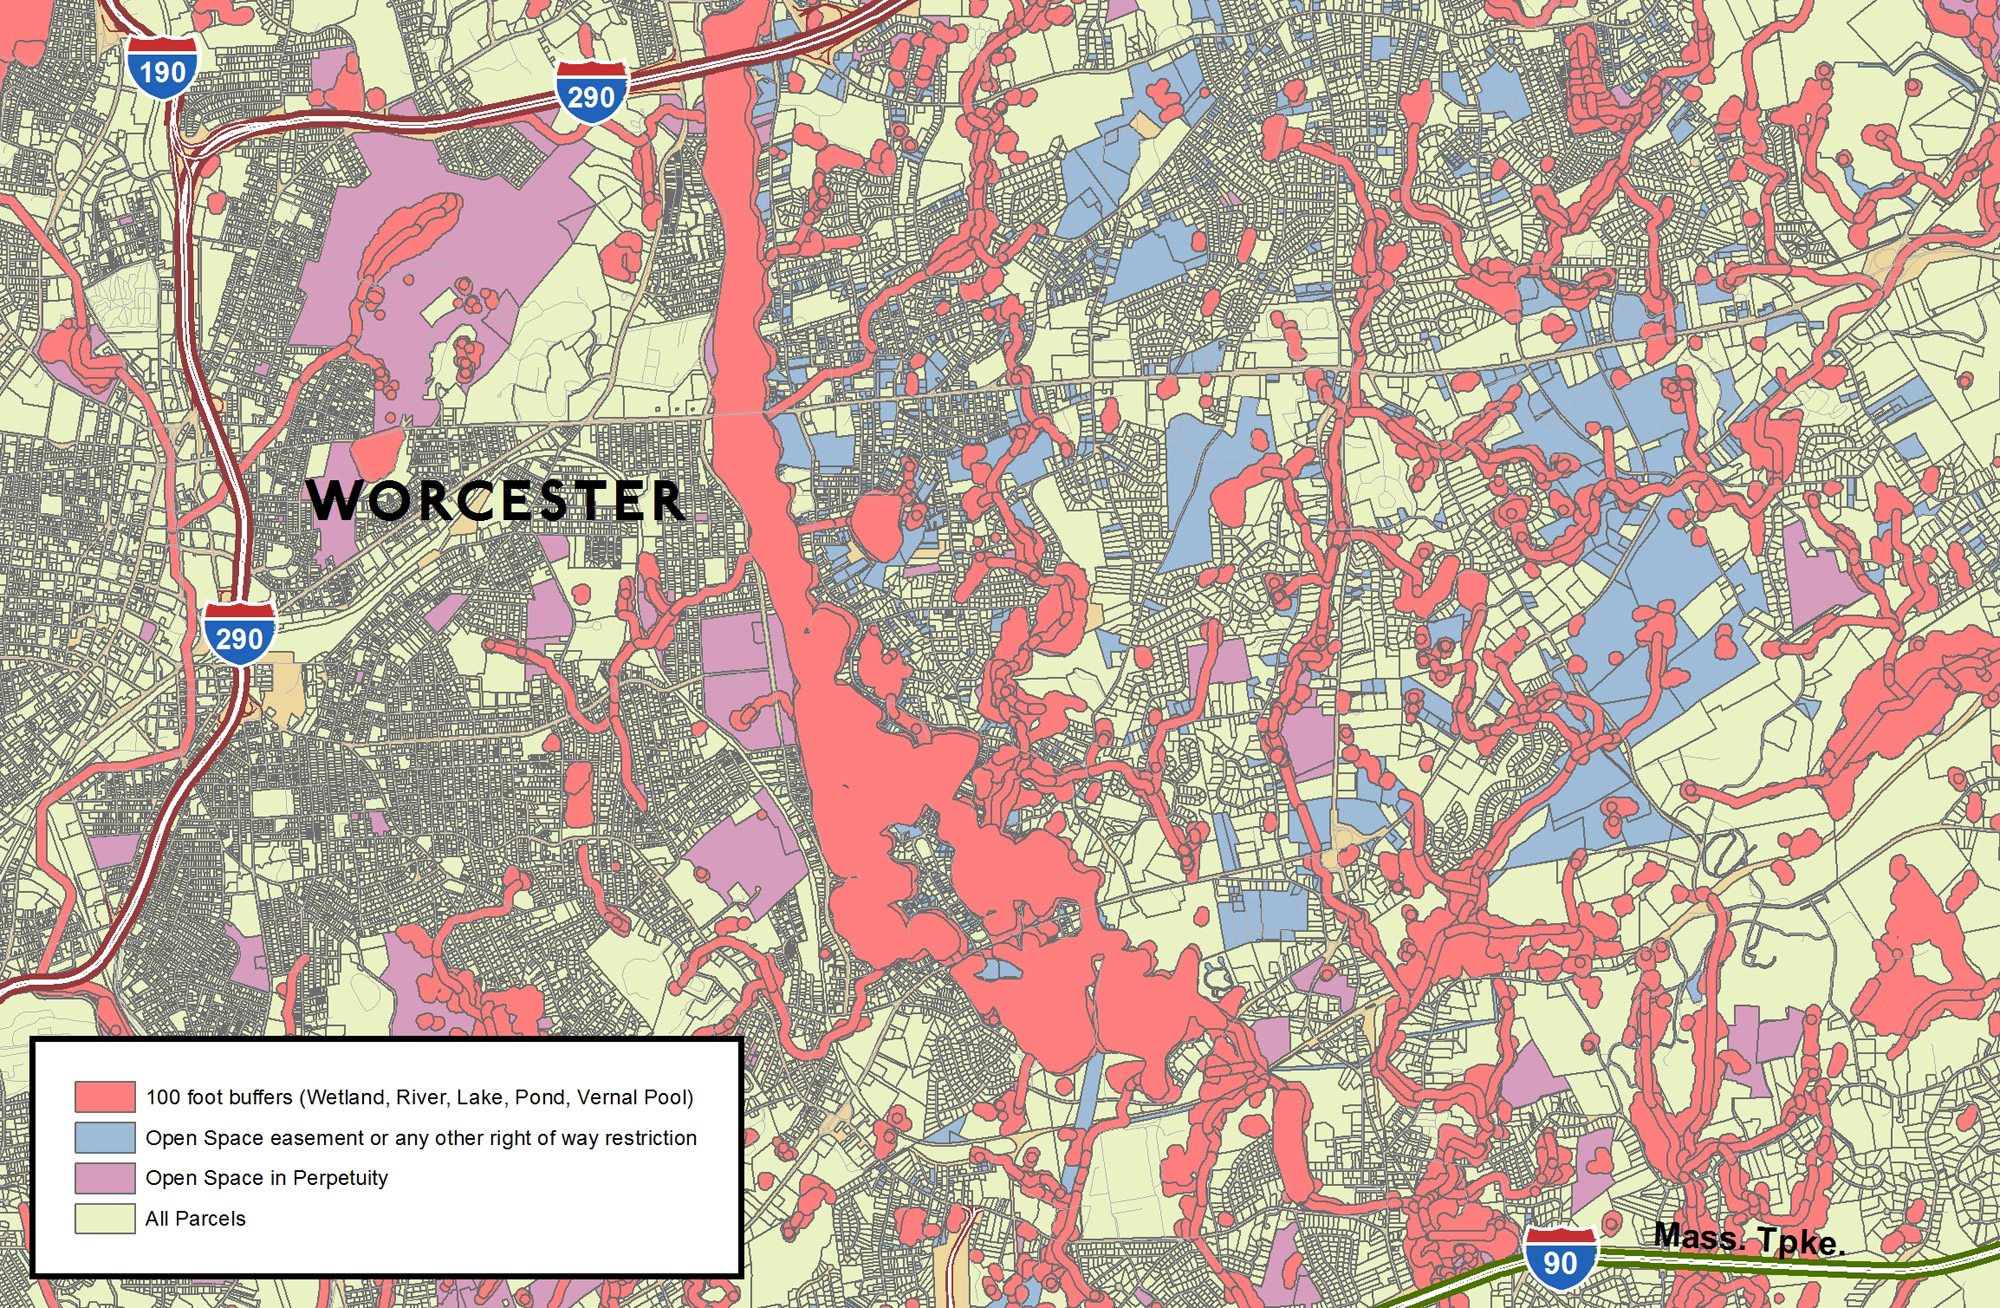
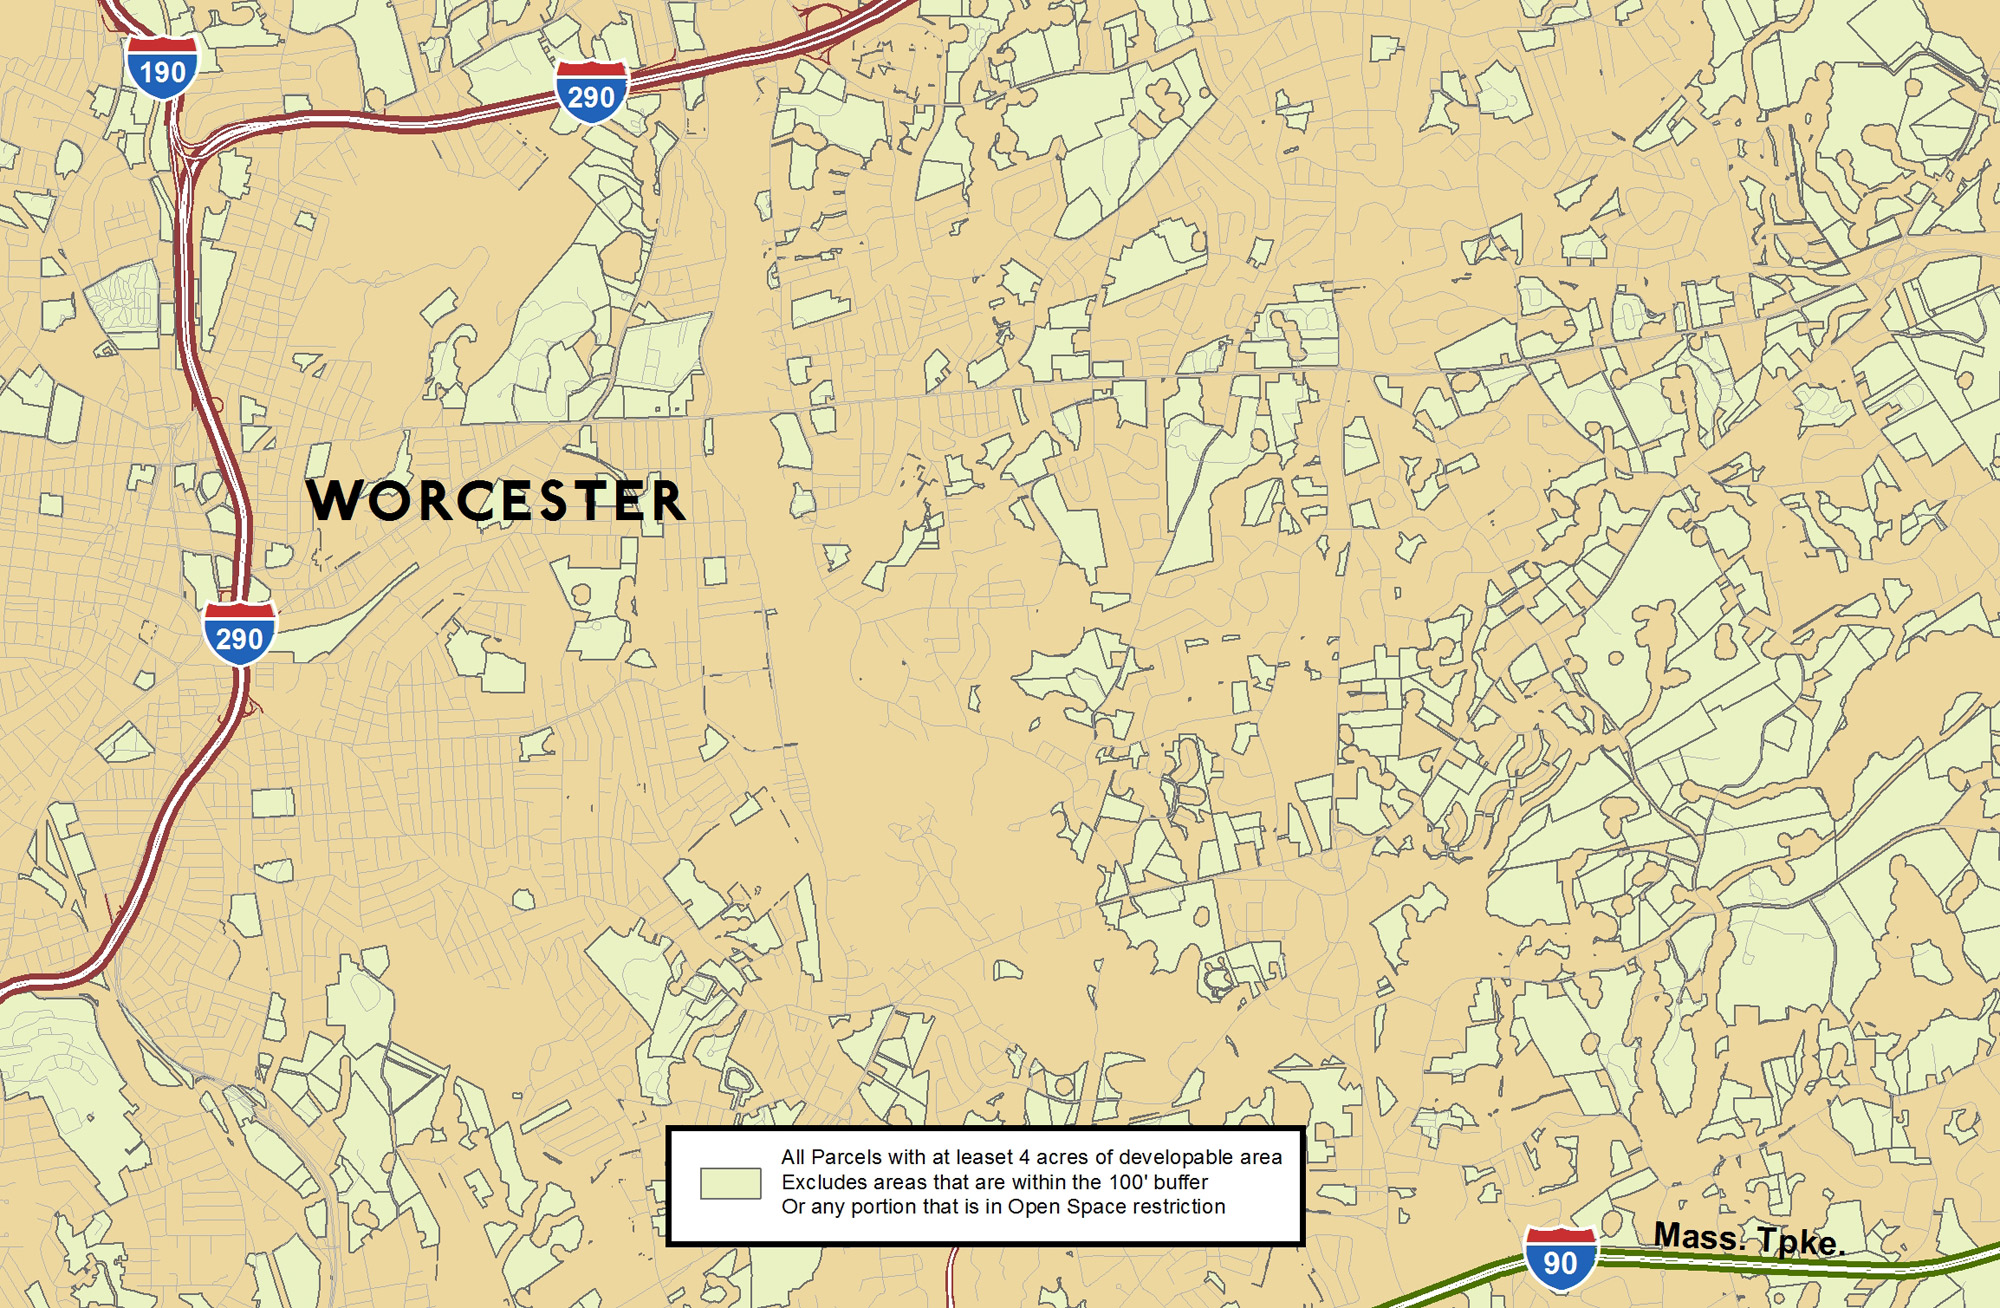
By means of GIS analysis, Red Paw was able to find several suitable parcels of land within the state which BlueWave could potentially use for its newest project. In this analysis, of the millions of land parcels within Massachusetts, BlueWave Solar needed Red Paw to find potential parcels using the following criteria: All parcels must have a minimum of 4 acres; parcels must exclude wetlands, rivers, streams and vernal pools; parcels must not be within a 100 foot buffer of wetlands, rivers, streams and vernal pools; must not include area of “Open Space in Perpetuity”; must not be considered a part of an open space easement or any other right-of-way restriction.
After running many analyses, Red Paw was successfully able to find several suitable parcels within the State of Massachusetts in which BlueWave Solar could potentially acquire and use for their next solar project. BlueWave later engaged Red Paw to run the same analyses in lower New York State.
